
Mastering Net Fixed Assets: The Formula and Real Calculation Examples
What Are Net Fixed Assets?
When a company buys a machine, a building, or a delivery vehicle, it records that asset at its original purchase price. But as years pass, the asset gets older, wears down, and its value on paper decreases. By the time that machine is five years old, it is not worth what the company originally paid for it.
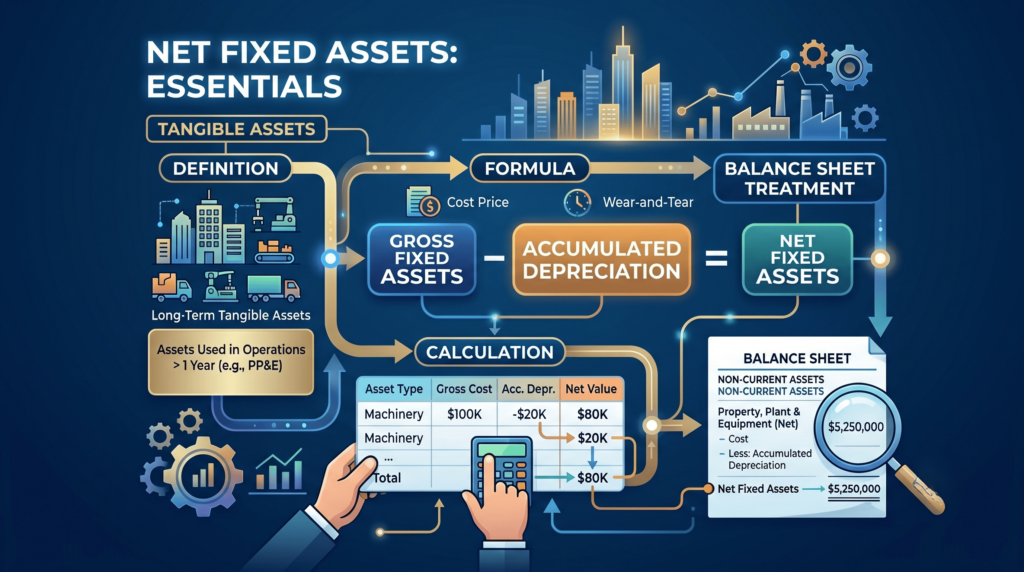
Net fixed assets is the value of a company’s fixed assets after subtracting all the depreciation that has accumulated on those assets since the day they were purchased.
It answers one simple question: what are the company’s long-term physical assets actually worth on the books today — after accounting for wear and tear?
Another way to understand it: if Gross Fixed Assets is what you paid for your assets, and Accumulated Depreciation is how much of that value has already been used up, then Net Fixed Assets is what remains.
Net Fixed Assets is also called:
- Net Book Value (NBV)
- Written Down Value (WDV)
- Carrying Amount (the term used in IFRS)
- Carrying Value
All four terms mean exactly the same thing. In this article we will use Net Fixed Assets and Net Book Value interchangeably, as they are the same concept.
Net Fixed Assets Formula
The formula is straightforward:
Net Fixed Assets = Gross Fixed Assets − Accumulated Depreciation
Or in its expanded form when impairment losses are also relevant:
Net Fixed Assets = Gross Fixed Assets − Accumulated Depreciation − Accumulated Impairment Losses
Where:
- Gross Fixed Assets = the total original cost of all fixed assets (also called historical cost or gross carrying amount)
- Accumulated Depreciation = the total depreciation charged on those assets from the date of purchase up to the current date
- Accumulated Impairment Losses = any reductions in value beyond normal depreciation, recognised when an asset’s recoverable amount falls below its carrying value (covered under IAS 36 — Impairment of Assets)
A simple example:
A company owns machinery originally purchased for $80,000. Over four years, the company has charged $32,000 in depreciation. There is no impairment.
Net Fixed Assets = $80,000 − $32,000 = $48,000
This means the machinery is carried on the balance sheet at $48,000 today — even though the company paid $80,000 for it originally.
What Are Fixed Assets? Understanding the Base
Before we go deeper into net fixed assets, it helps to be clear on what fixed assets are.
Fixed assets (also called non-current assets or long-term assets) are assets that a company owns and uses in its business operations over a long period — generally more than one year — and are not held for resale in the ordinary course of business.
They are the physical tools a business uses to generate revenue. A factory uses its machinery. A logistics company uses its trucks. A hotel uses its building. A hospital uses its medical equipment.
Fixed assets are also called Plant, Property & Equipment (PP&E) — the term used in both IFRS (IAS 16) and US GAAP (ASC 360). In older accounting literature and South Asian textbooks, they are also called plant assets or tangible fixed assets.
The key characteristics of a fixed asset are:
- Held for use in production, supply of goods/services, for rental, or for administrative purposes
- Expected to be used for more than one accounting period
- Not held for sale in the ordinary course of business
- Has physical substance (tangible)
This last point distinguishes fixed assets from intangible assets like patents, trademarks, or goodwill — which also appear on the balance sheet but have no physical form.
Types of Fixed Assets
Fixed assets come in several categories. Each appears on the balance sheet and is subject to depreciation (with one notable exception — land).
Land
Land is the ground on which a business operates. It has an indefinite useful life and is therefore never depreciated. It appears on the balance sheet at historical cost indefinitely (unless revalued or impaired).
Example: A company buys a plot of land for $500,000. It stays on the balance sheet at $500,000 forever unless sold or revalued.
Buildings
The physical structures — factories, offices, warehouses, retail outlets. Unlike land, buildings deteriorate over time and are depreciated over their useful life (commonly 25 to 50 years).
Example: A warehouse purchased for $1,200,000 with a 40-year useful life. Annual straight-line depreciation = $1,200,000 ÷ 40 = $30,000 per year.
Machinery and Equipment
Manufacturing machines, computers, printers, scientific equipment, medical devices. Typically depreciated over 3 to 15 years depending on the type.
Vehicles
Cars, trucks, forklifts, delivery vans. Typically depreciated over 3 to 8 years.
Furniture and Fixtures
Office furniture, shelving, built-in fittings. Typically 5 to 10 years useful life.
Leasehold Improvements
These are improvements made to a property that a business rents (leases) rather than owns. Since the company does not own the building, leasehold improvements are amortised over the shorter of the lease term or the useful life of the improvement.
Example: A retail chain rents a shop on a 7-year lease and spends $120,000 fitting it out with shelving, lighting, and flooring. These leasehold improvements are amortised over 7 years — the lease period. Annual amortisation = $120,000 ÷ 7 = $17,143 per year.
Construction in Progress (CIP)
This is a special category. When a company is in the process of building a new asset — constructing a factory, installing a large machine, developing a custom software system — the cost accumulates in a Construction in Progress account while the work is underway.
Construction in Progress is classified as a fixed asset on the balance sheet but is not depreciated until the asset is complete and placed into service. Once construction is finished and the asset is ready for use, it is transferred out of CIP and into the appropriate fixed asset category, at which point depreciation begins.
Example: A pharmaceutical company is building a new production facility. As of the balance sheet date, $4.5 million has been spent so far and construction is 70% complete. The $4.5 million appears on the balance sheet as Construction in Progress. No depreciation is charged yet. When the facility is completed next year and operations begin, it will be reclassified as Buildings and depreciation will start.
Construction in Progress is therefore always shown at cost — it represents gross investment that has not yet started being consumed through use.
What is Accumulated Depreciation?
Accumulated depreciation is the total depreciation expense charged on a fixed asset from the date it was acquired up to the current balance sheet date.
Every accounting period, a company charges a depreciation expense on its fixed assets — recognising that the asset is being gradually used up. That periodic charge builds up over time and the running total is called accumulated depreciation.
Accumulated Depreciation is a contra-asset account. This is a key concept that confuses many students.
A contra-asset account sits alongside the related asset account but carries the opposite balance. Assets normally have a debit balance. Accumulated depreciation has a credit balance because it reduces the value of the asset.
So on the balance sheet, you see:
Machinery (at cost)                   $80,000
Less: Accumulated Depreciation       ($32,000)
Net Book Value / Net Fixed Assets     $48,000
The accumulated depreciation ($32,000) is not an expense on the income statement — it is the running total of all past depreciation charges. The annual depreciation charge goes to the income statement as depreciation expense. The running total stays on the balance sheet as accumulated depreciation.
Is Accumulated Depreciation an Asset?
No. Although it appears on the asset side of the balance sheet (because it is a contra-asset), accumulated depreciation is not an asset in itself. It is a reduction of an asset. It represents the portion of an asset’s cost that has already been consumed and recognised as expense.
Think of it like this: if the machine is a loaf of bread, accumulated depreciation is how many slices have already been eaten. The remaining slices (net fixed assets) are what is left. The eaten slices are not stored somewhere — they are simply gone.
Is Accumulated Depreciation a Debit or Credit?
Accumulated depreciation has a credit balance because it is a contra-asset account that offsets the debit balance of the related fixed asset account.
When annual depreciation is recorded, the journal entry is:
Dr. Depreciation Expense       [amount]
    Cr. Accumulated Depreciation   [amount]
The credit to accumulated depreciation increases it. Over time, as credits accumulate year after year, the accumulated depreciation balance grows. The corresponding debits go to depreciation expense on the income statement each year.
Where Does Accumulated Depreciation Go on a Balance Sheet?
Accumulated depreciation appears on the balance sheet directly below the related fixed asset, presented as a deduction. It is placed within the non-current assets section, immediately under the gross (historical) cost of each asset category.
Here is how it looks in a properly formatted balance sheet (following IAS 16 / IFRS presentation):
NON-CURRENT ASSETS

Property, Plant & Equipment:
  Land                                      500,000
  Buildings (at cost)         1,200,000
  Less: Accumulated Depreciation (240,000)   960,000
  Machinery (at cost)           800,000
  Less: Accumulated Depreciation (320,000)   480,000
  Vehicles (at cost)            180,000
  Less: Accumulated Depreciation  (72,000)   108,000
  Construction in Progress                   450,000
                                           ---------
Total Net Fixed Assets (PP&E)              2,498,000
The balance sheet shows both the gross cost and the accumulated depreciation so that users can see how old and how depreciated the asset base is. An asset base that is heavily depreciated (accumulated depreciation close to gross cost) signals that the company’s fixed assets are aging and may need replacement soon.
How to Calculate Net Fixed Assets: Step-by-Step
Let us work through a full calculation using a realistic example.
Scenario: Blue Horizon Manufacturing Ltd has the following fixed assets as of 31 December 2024:
| Asset | Date Acquired | Cost | Useful Life | Method | Depreciation to Date |
|---|---|---|---|---|---|
| Land | Jan 2018 | $500,000 | Indefinite | None | $0 |
| Factory Building | Jan 2020 | $1,200,000 | 40 years | Straight-Line | $120,000 |
| Machinery A | Jan 2021 | $800,000 | 10 years | Straight-Line | $320,000 |
| Machinery B | Jan 2023 | $300,000 | 10 years | Straight-Line | $60,000 |
| Vehicles | Jan 2022 | $180,000 | 5 years | Straight-Line | $108,000 |
| Office Furniture | Jan 2022 | $50,000 | 10 years | Straight-Line | $15,000 |
| Construction in Progress | Various | $450,000 | N/A (not complete) | None | $0 |
Step 1: Total Gross Fixed Assets
Add up the cost of all fixed assets:
500,000 + 1,200,000 + 800,000 + 300,000 + 180,000 + 50,000 + 450,000 = $3,480,000
Step 2: Total Accumulated Depreciation
Add up all accumulated depreciation (note: land and CIP have zero):
0 + 120,000 + 320,000 + 60,000 + 108,000 + 15,000 + 0 = $623,000
Step 3: Calculate Net Fixed Assets
Net Fixed Assets = Gross Fixed Assets − Accumulated Depreciation
= $3,480,000 − $623,000 = $2,857,000
Step 4: Verify Individual Asset Net Book Values
| Asset | Gross Cost | Accum. Dep. | Net Book Value |
|---|---|---|---|
| Land | $500,000 | $0 | $500,000 |
| Factory Building | $1,200,000 | $120,000 | $1,080,000 |
| Machinery A | $800,000 | $320,000 | $480,000 |
| Machinery B | $300,000 | $60,000 | $240,000 |
| Vehicles | $180,000 | $108,000 | $72,000 |
| Office Furniture | $50,000 | $15,000 | $35,000 |
| Construction in Progress | $450,000 | $0 | $450,000 |
| TOTAL | $3,480,000 | $623,000 | $2,857,000 |
Blue Horizon Manufacturing’s net fixed assets on the balance sheet = $2,857,000.
Depreciation Methods: How Accumulated Depreciation is Built Up
The method a company uses to calculate annual depreciation directly affects how quickly accumulated depreciation grows — and therefore how quickly net fixed assets decline.
There are three main methods:
Method 1: Straight-Line Method (SLM)
The most common method. The same depreciation amount is charged every year.
Annual Depreciation = (Cost − Residual Value) ÷ Useful Life
Where:
- Residual Value (also called salvage value or scrap value) = the estimated value of the asset at the end of its useful life
- Useful Life = estimated number of years the asset will be used
Example:
Machinery costs $80,000. Residual value = $8,000. Useful life = 8 years.
Annual Depreciation = ($80,000 − $8,000) ÷ 8 = $9,000 per year
After Year 1: Accumulated Depreciation = $9,000. Net Book Value = $71,000
After Year 4: Accumulated Depreciation = $36,000. Net Book Value = $44,000
After Year 8: Accumulated Depreciation = $72,000. Net Book Value = $8,000 (residual value)
The net book value falls in a straight line — $9,000 each year, predictably.
Method 2: Written Down Value / Reducing Balance Method (WDV)
Depreciation is charged as a fixed percentage of the asset’s net book value at the beginning of each year. Because the net book value falls each year, the depreciation charge also falls each year — higher in early years, lower in later years.
Annual Depreciation = Net Book Value at Start of Year × Depreciation Rate
Example:
Machinery costs $80,000. Depreciation rate = 25% reducing balance.
Year 1: Depreciation = 25% × $80,000 = $20,000. NBV = $60,000
Year 2: Depreciation = 25% × $60,000 = $15,000. NBV = $45,000
Year 3: Depreciation = 25% × $45,000 = $11,250. NBV = $33,750
Year 4: Depreciation = 25% × $33,750 = $8,438. NBV = $25,313
The reducing balance method better reflects the usage pattern of assets that lose value quickly in early years — like cars and technology equipment.
Method 3: Double Declining Balance Method (DDB)
A more aggressive version of the reducing balance method. The depreciation rate is double the straight-line rate.
DDB Rate = (1 ÷ Useful Life) × 2
Example:
Machinery costs $80,000. Useful life = 8 years.
Straight-line rate = 1 ÷ 8 = 12.5%
DDB rate = 12.5% × 2 = 25%
Year 1: 25% × $80,000 = $20,000. NBV = $60,000
Year 2: 25% × $60,000 = $15,000. NBV = $45,000
Year 3: 25% × $45,000 = $11,250. NBV = $33,750
In practice, companies using DDB often switch to straight-line in later years once the straight-line charge becomes higher than the DDB charge — ensuring the asset is fully depreciated by end of useful life.
DDB is common in industries where assets become technologically obsolete quickly, such as technology hardware or fast-moving equipment.
Comparison of Methods on a $80,000 Machine (8-year life, zero residual)
| Year | Straight-Line NBV | Reducing Balance (25%) NBV | Double Declining (25%) NBV |
|---|---|---|---|
| 0 (purchase) | $80,000 | $80,000 | $80,000 |
| 1 | $70,000 | $60,000 | $60,000 |
| 2 | $60,000 | $45,000 | $45,000 |
| 3 | $50,000 | $33,750 | $33,750 |
| 5 | $30,000 | $18,984 | $18,984 |
| 8 | $0 | $10,094* | $0 |
Reducing balance never fully reaches zero unless a final write-off is made.
The choice of depreciation method significantly affects net fixed assets on the balance sheet. A company using the reducing balance method will show lower net fixed assets in early years compared to one using the straight-line method — even for identical assets.
Net Fixed Assets vs Gross Fixed Assets: The Key Difference
| Feature | Gross Fixed Assets | Net Fixed Assets |
|---|---|---|
| Definition | Total original cost of all fixed assets | Cost minus accumulated depreciation |
| What it shows | Total investment in fixed assets | Current book value of fixed assets |
| Changes when | New assets are purchased or disposed | Depreciation is charged or asset is disposed |
| Affected by depreciation? | No | Yes |
| Useful for | Understanding total capital invested in assets | Understanding current carrying value on books |
Gross fixed assets tell you how much the company has invested over time in physical assets.
Net fixed assets tell you what those investments are currently worth on paper.
Both are useful. Gross assets help you understand investment history. Net assets help you understand balance sheet value and depreciation coverage.
Net Fixed Assets on the Balance Sheet: Presentation
Under IAS 16 — Property, Plant and Equipment (the IFRS standard governing fixed assets), companies must disclose for each class of fixed assets:
- The gross carrying amount at the beginning and end of the period
- Accumulated depreciation at the beginning and end of the period
- Additions, disposals, revaluations, and impairment losses during the period
- The carrying amount (net fixed assets) at the end of the period
This means the balance sheet and its notes together give a full picture of the fixed asset position. The balance sheet shows the closing net figure; the notes to the accounts show the detailed movement (called a fixed asset schedule or PP&E roll-forward).
A typical PP&E note in a company’s financial statements looks like this:
Note X: Property, Plant & Equipment — Year ended 31 December 2024
| Land | Buildings | Machinery | Vehicles | Total | |
|---|---|---|---|---|---|
| Cost | |||||
| Opening balance | 500,000 | 1,200,000 | 1,000,000 | 180,000 | 2,880,000 |
| Additions | 0 | 0 | 100,000 | 0 | 100,000 |
| Disposals | 0 | 0 | 0 | (50,000) | (50,000) |
| Closing balance | 500,000 | 1,200,000 | 1,100,000 | 130,000 | 2,930,000 |
| Accumulated Depreciation | |||||
| Opening balance | 0 | 90,000 | 280,000 | 72,000 | 442,000 |
| Charge for year | 0 | 30,000 | 110,000 | 26,000 | 166,000 |
| Eliminated on disposal | 0 | 0 | 0 | (36,000) | (36,000) |
| Closing balance | 0 | 120,000 | 390,000 | 62,000 | 572,000 |
| Net Book Value | |||||
| 31 December 2024 | 500,000 | 1,080,000 | 710,000 | 68,000 | 2,358,000 |
| 31 December 2023 | 500,000 | 1,110,000 | 720,000 | 108,000 | 2,438,000 |
This schedule is highly informative. You can see exactly what was bought, what was scrapped, how much depreciation was charged in the year, and what the net book value is at both the start and end of the period.
Journal Entries for Fixed Assets
Understanding net fixed assets requires understanding the key journal entries that change the numbers.
Entry 1: Purchasing a Fixed Asset
When an asset is bought:
Dr. Machinery (Fixed Asset)        100,000
    Cr. Bank / Accounts Payable        100,000
This increases gross fixed assets by $100,000. Net fixed assets also increase by $100,000 at this point (no depreciation yet).
Entry 2: Annual Depreciation Charge
At the end of each accounting period:
Dr. Depreciation Expense            10,000
    Cr. Accumulated Depreciation        10,000
This increases accumulated depreciation by $10,000, which reduces net fixed assets by $10,000. The $10,000 depreciation expense also reduces profit on the income statement.
Entry 3: Disposing of a Fixed Asset (Fully Depreciated)
When an asset with zero net book value is scrapped:
Dr. Accumulated Depreciation       100,000
    Cr. Machinery (Fixed Asset)        100,000
Both gross fixed assets and accumulated depreciation are removed. Net fixed assets remain unchanged (both sides cancel out).
Entry 4: Disposing of an Asset with a Gain
Machine cost $100,000, accumulated depreciation $60,000, sold for $55,000.
Net Book Value = $100,000 − $60,000 = $40,000
Sale Price = $55,000
Profit on disposal = $55,000 − $40,000 = $15,000
Dr. Bank                            55,000
Dr. Accumulated Depreciation        60,000
    Cr. Machinery (Fixed Asset)        100,000
    Cr. Profit on Disposal              15,000
Entry 5: Disposing of an Asset with a Loss
Same machine, but sold for $30,000 instead of $55,000.
Net Book Value = $40,000
Sale Price = $30,000
Loss on disposal = $40,000 − $30,000 = $10,000
Dr. Bank                            30,000
Dr. Accumulated Depreciation        60,000
Dr. Loss on Disposal                10,000
    Cr. Machinery (Fixed Asset)        100,000
Profits and losses on disposal appear in the income statement. Under IAS 16, they are presented as a net figure (gain or loss) within profit or loss, not as revenue or an additional cost.
Fixed Asset Turnover Ratio: Using Net Fixed Assets in Analysis
Net fixed assets is not just a balance sheet figure — it is used in an important financial ratio called the Fixed Asset Turnover Ratio.
Fixed Asset Turnover Ratio = Net Revenue ÷ Average Net Fixed Assets
Where:
Average Net Fixed Assets = (Opening Net Fixed Assets + Closing Net Fixed Assets) ÷ 2
This ratio tells you how efficiently a company uses its fixed assets to generate revenue.
Example:
Blue Horizon Manufacturing had:
- Net Revenue: $8,500,000
- Opening Net Fixed Assets: $3,100,000
- Closing Net Fixed Assets: $2,857,000
- Average Net Fixed Assets: ($3,100,000 + $2,857,000) ÷ 2 = $2,978,500
Fixed Asset Turnover = $8,500,000 ÷ $2,978,500 = 2.85 times
This means that for every $1 of net fixed assets, Blue Horizon generates $2.85 in revenue.
Interpretation:
A higher ratio generally means the company is using its assets efficiently — generating more revenue from the same asset base. A lower ratio may indicate underutilised assets, overcapacity, or a recent large investment in assets that has not yet generated revenue.
However, this ratio must be compared carefully. Capital-intensive industries (manufacturing, utilities, airlines) naturally have lower ratios than service businesses (consulting, software) because they have much larger fixed asset bases relative to revenue.
Also, a company with heavily depreciated assets will show a high ratio simply because net fixed assets are very low — not because it is genuinely efficient. This is why looking at both gross and net fixed assets together gives a more complete picture.
Revaluation of Fixed Assets
Under IAS 16, companies have a choice: they can carry fixed assets using the cost model (historical cost less accumulated depreciation, which is what we have discussed throughout this article) or the revaluation model (where assets are carried at fair value, periodically reassessed).
When an asset is revalued upward:
- The asset account increases
- A Revaluation Surplus is created in equity (not in profit or loss)
Example: A building carried at $960,000 (net book value) is revalued to $1,400,000.
Dr. Buildings (Fixed Asset)        440,000
    Cr. Revaluation Surplus (Equity)   440,000
The revaluation surplus appears in the equity section of the balance sheet as Other Comprehensive Income (OCI). Depreciation after revaluation is based on the new higher value.
The revaluation model is more common in jurisdictions with significant inflation or where property values change substantially — including parts of South Asia and the Middle East.
Net Fixed Assets vs Net Book Value: Are They the Same?
Yes — and no. It depends on context.
Net Book Value (NBV) is a general term that can apply to any asset — fixed assets, intangibles, or even investments. It simply means the carrying amount of an asset after deducting accumulated depreciation or amortisation.
Net Fixed Assets specifically refers to the net book value of tangible fixed assets (PP&E) as a group on the balance sheet.
So: Net Fixed Assets = Net Book Value of PP&E
But Net Book Value can also refer to the value of a single asset (e.g., the net book value of Machine A is $48,000) or to intangibles (e.g., the net book value of a patent after amortisation).
In financial analysis, when analysts say “net fixed assets,” they mean the total net PP&E on the balance sheet. When they say “net book value,” they are usually referring to a single asset or to the concept more broadly.
Why Net Fixed Assets Matter for Decision-Making
Net fixed assets are not just an accounting number — they carry real business meaning.
For lenders and creditors: Banks and lenders look at net fixed assets when assessing whether to extend secured loans. Fixed assets (especially land and buildings) often serve as loan collateral. The net fixed asset value sets the ceiling on what can realistically be recovered if the borrower defaults.
For investors: A declining net fixed assets figure year-on-year (when no new assets are being purchased) tells an investor that the company’s asset base is aging. Eventually, these assets will need to be replaced — which requires significant capital expenditure. An investor who ignores this faces an unexpected capex demand later.
For management: Tracking the age of the fixed asset base (average net book value as a percentage of gross cost) helps management plan for asset replacement. If assets are 80% depreciated, replacement planning needs to begin now — not after the assets fail.
For analysts (capital intensity): Capital-intensive businesses (like manufacturers or airlines) have large net fixed assets relative to revenue. Understanding this ratio helps analysts benchmark companies within the same industry.
For auditors: Net fixed assets is usually a material line item on the balance sheet. Auditors test the existence of fixed assets, confirm ownership, verify the appropriateness of useful lives and depreciation rates, and check that disposals have been recorded correctly.
Common Mistakes and Misunderstandings
Mistake 1: Forgetting to charge depreciation for a partial year
If an asset is purchased mid-year, depreciation for that year should be calculated on a pro-rata basis. An asset bought on 1 July in a company with a 31 December year-end attracts only 6 months’ depreciation in the first year.
Mistake 2: Treating accumulated depreciation as cash set aside
Accumulated depreciation is an accounting entry, not a cash reserve. It does not mean the company has saved money to replace the asset. Many businesses confuse this and are surprised when a fully depreciated asset fails and replacement cash is not available.
Mistake 3: Depreciating land
Land is never depreciated under any accounting standard (IAS 16, US GAAP). Its useful life is indefinite. Even if land value falls, this is recognised as impairment — not depreciation.
Mistake 4: Including Construction in Progress in depreciation calculations
CIP assets are not yet in use, so they are never depreciated until the project is complete and the asset is placed into service.
Mistake 5: Using net fixed assets without checking the depreciation method
Two companies with identical assets can show very different net fixed asset figures if they use different depreciation methods. Always check the accounting policy note before comparing net fixed assets across companies.
Summary
- Net fixed assets = Gross Fixed Assets − Accumulated Depreciation (± Impairment). Also called Net Book Value or Carrying Amount.
- Gross fixed assets is the total original cost. Accumulated depreciation is the running total of all depreciation charged to date.
- Fixed assets include land, buildings, machinery, vehicles, furniture, leasehold improvements, and construction in progress.
- Land is never depreciated. Construction in Progress is not depreciated until the asset is complete.
- Accumulated depreciation is a contra-asset — it has a credit balance and appears as a deduction from gross fixed assets on the balance sheet.
- The three main depreciation methods — straight-line, reducing balance, and double declining balance — each produce different accumulation patterns and therefore different net fixed asset values.
- Fixed Asset Turnover Ratio = Revenue ÷ Average Net Fixed Assets. Measures how efficiently assets generate revenue.
- Net fixed assets matter to lenders (collateral), investors (asset aging), management (replacement planning), and auditors (material balance sheet item).
Frequently Asked Questions (FAQs)
Technically, yes — but only if accumulated depreciation exceeds gross cost, which should not happen under correct accounting. Once an asset is fully depreciated (net book value = zero or residual value), no further depreciation should be charged. A negative NBV usually signals an accounting error in the depreciation calculation.
Depreciation applies to tangible fixed assets (PP&E) — physical things that wear out. Amortisation applies to intangible assets — things like patents, licences, and software — that are used up over time but have no physical form. Both reduce the carrying value of an asset over its useful life, but they apply to different types of assets.
Not necessarily. High net fixed assets simply means the company has significant physical assets on its books. Whether those assets are being used productively is measured by the fixed asset turnover ratio. A company could have very high net fixed assets but very low revenue — which is inefficiency, not success.
Net fixed assets increase — the gross carrying amount goes up, and the increase goes to a Revaluation Surplus in equity (Other Comprehensive Income). Future depreciation is then based on the higher revalued amount.
The cash flow statement (indirect method) adjusts net profit for non-cash items. Since depreciation is a non-cash expense, it is added back in the operating activities section. Capital expenditure (purchase of new fixed assets) appears as a cash outflow under investing activities. Proceeds from sale of fixed assets appear as a cash inflow under investing activities.
Bangladesh Financial Reporting Standards (BFRS) are substantially converged with IFRS. BFRS 16 (equivalent to IAS 16) governs PP&E treatment in Bangladesh. The core rules — historical cost, depreciation, impairment, and disclosure requirements — are the same as IFRS. Companies listed on the Dhaka Stock Exchange are required to follow BFRS.
References
- International Accounting Standards Board (IASB). IAS 16 — Property, Plant and Equipment. Available at: ifrs.org
- International Accounting Standards Board (IASB). IAS 36 — Impairment of Assets. Available at: ifrs.org
- Financial Accounting Standards Board (FASB). ASC 360 — Property, Plant and Equipment (US GAAP). Available at: fasb.org
- Institute of Chartered Accountants of Bangladesh (ICAB). Bangladesh Financial Reporting Standards (BFRS). Available at: icab.org.bd
- International Auditing and Assurance Standards Board (IAASB). ISA 315 (Revised 2019) — Identifying and Assessing Risks of Material Misstatement. Available at: iaasb.org
- Weygandt, J.J., Kimmel, P.D. and Kieso, D.E. Accounting Principles. 14th edition. Wiley, 2022. (Chapter on Plant Assets, Natural Resources, and Intangibles)
- Horngren, C.T., Harrison, W.T. and Oliver, M.S. Accounting. 10th edition. Pearson, 2020. (Long-term Assets chapter)
- Penman, S.H. Financial Statement Analysis and Security Valuation. 5th edition. McGraw-Hill, 2013. (Fixed asset analysis and fixed asset turnover)
Disclaimer: Content is for educational purposes. For specific accounting treatment or audit advice, consult a qualified professional.
