
Investment Appraisal: NPV, IRR, Payback & ARR — The Four Methods, and Why They Disagree
The $2 Million Question Every Business Eventually Faces
A company has $2 million to invest. In front of it sit two projects. Both cost exactly $2 million. Both run for five years. Project A returns more cash overall; Project B returns its cash faster. One has a higher percentage return; the other adds more absolute value.
Which do you pick?
Here’s the uncomfortable truth that almost no online guide tells you plainly: the four standard appraisal methods can each point to a different answer for the same two projects. Payback might favour B. Accounting Rate of Return might favour A. NPV might say A, while IRR says B. They can’t all be right and knowing which method to trust when they conflict is the single most valuable thing in this entire topic.
This article does three things most competing guides don’t. It works every calculation by hand, including the IRR interpolation that nearly every other site skips with “just use Excel.” It uses one consistent project across all four methods, so you can see exactly where they agree and diverge. And it resolves the conflicts properly explaining not just that NPV and IRR disagree, but why, and which one wins.
Everything here builds directly on the present value factors from our PV factor table article if discounting feels shaky, that’s the place to start.
What is Investment Appraisal?
Investment appraisal (also called capital budgeting) is the process of evaluating whether a proposed long-term investment a new factory, a piece of equipment, a product line, an acquisition is financially worthwhile.
Because these decisions involve large sums committed over many years, getting them wrong is expensive and hard to reverse. Investment appraisal provides a structured, numbers-based framework for answering two questions: should we invest at all? (the accept/reject decision), and if we can’t do everything, which projects should we prioritise? (the ranking decision).
The four most widely used methods split into two families:
Non-discounting methods — which ignore the time value of money:
- Payback Period
- Accounting Rate of Return (ARR)
Discounting methods — which incorporate the time value of money (the principle established in our PV factor table article):
- Net Present Value (NPV)
- Internal Rate of Return (IRR)
We’ll build all four around a single running example, then compare them head to head.
The Running Example: Meridian’s Machine Decision
We’ll reuse Meridian Sports Equipment from our contribution margin article. Meridian is considering buying a new automated stringing machine.
Project facts:
- Initial investment (Year 0): $100,000
- Expected useful life: 5 years
- Cost of capital (discount rate): 10%
- Expected residual (scrap) value at end of Year 5: $0
- Expected net cash inflows:
| Year | Net cash inflow |
|---|---|
| 1 | $30,000 |
| 2 | $35,000 |
| 3 | $30,000 |
| 4 | $25,000 |
| 5 | $20,000 |
| Total | $140,000 |
The machine generates $140,000 of cash over five years against a $100,000 cost a $40,000 surplus in raw terms. But raw terms ignore timing. Let’s see what each method makes of it.
Method 1: Payback Period
The payback period is the length of time it takes for a project’s cumulative cash inflows to recover the initial investment.
It answers one blunt question: how long until we get our money back?
Calculation
We accumulate the cash inflows year by year until they reach the $100,000 initial cost:
| Year | Cash inflow | Cumulative cash inflow |
|---|---|---|
| 1 | $30,000 | $30,000 |
| 2 | $35,000 | $65,000 |
| 3 | $30,000 | $95,000 |
| 4 | $25,000 | $120,000 |
| 5 | $20,000 | $140,000 |
By the end of Year 3, $95,000 has been recovered $5,000 short. During Year 4, a further $25,000 comes in. So the remaining $5,000 is recovered partway through Year 4:
Fraction of Year 4 needed = $5,000 ÷ $25,000 = 0.2 years
Payback period = 3 + 0.2 = 3.2 years
Strengths and Weaknesses
Payback is genuinely useful as a quick liquidity and risk screen a business worried about cash or about an uncertain future often wants its money back fast, and payback speaks directly to that. It’s simple to calculate and easy to explain to non-financial managers.
But it has two serious flaws. First, it ignores the time value of money it treats a $30,000 inflow in Year 1 as identical to a $30,000 inflow in Year 3, which we know from our PV factor table article is wrong. Second, and more damning, it completely ignores everything that happens after the payback point. A project that pays back in 3.2 years and then earns millions looks identical to one that pays back in 3.2 years and then collapses. Payback is blind to total profitability.
(A refinement, the discounted payback period, fixes the first flaw by discounting each cash flow before accumulating it — but it still ignores cash flows beyond the payback point, so the second flaw remains.)
Method 2: Accounting Rate of Return (ARR)
The Accounting Rate of Return expresses the average annual accounting profit a project generates as a percentage of the investment.
Unlike the other three methods, ARR is based on accounting profit not cash flow. This is a crucial distinction, because profit is calculated after deducting depreciation (the non-cash charge covered in our net fixed assets article), whereas the other three methods use raw cash flows.
Calculation
ARR = (Average Annual Accounting Profit ÷ Average Investment) × 100
Step 1 — Convert cash flows to accounting profit by deducting depreciation. With a $100,000 machine, $0 residual, and 5-year life, straight-line depreciation = $100,000 ÷ 5 = $20,000 per year.
| Year | Cash inflow | Less depreciation | Accounting profit |
|---|---|---|---|
| 1 | $30,000 | $20,000 | $10,000 |
| 2 | $35,000 | $20,000 | $15,000 |
| 3 | $30,000 | $20,000 | $10,000 |
| 4 | $25,000 | $20,000 | $5,000 |
| 5 | $20,000 | $20,000 | $0 |
| Total | $40,000 |
Step 2 — Average annual profit = $40,000 ÷ 5 = $8,000
Step 3 — Average investment = (Initial Investment + Residual Value) ÷ 2 = ($100,000 + $0) ÷ 2 = $50,000
Step 4 — ARR = ($8,000 ÷ $50,000) × 100 = 16%
If Meridian’s required accounting return (the “target ARR”) is, say, 12%, this project’s 16% clears the hurdle and would be accepted on an ARR basis.
Strengths and Weaknesses
ARR’s appeal is that it speaks the language of the financial statements it’s expressed as a percentage return, and it ties to the profit figures and return-on-capital ratios that managers and investors already track. It considers the project’s entire life, fixing payback’s second flaw.
But it shares payback’s first flaw it ignores the time value of money and it adds a new problem: it’s based on profit, not cash. Profit is affected by accounting policy choices (the depreciation method, for instance recall how straight-line vs reducing balance produce very different profit profiles in our double declining balance article), which means two companies appraising the identical project could compute different ARRs purely because of accounting choices. There’s also no single universal definition: some texts use initial investment rather than average investment in the denominator, producing a different figure. Always confirm which definition is in use.
Method 3: Net Present Value (NPV) — The Gold Standard
Net Present Value is the sum of all a project’s cash flows, each discounted to its present value, minus the initial investment.
This is the method most finance theorists regard as superior, because it directly measures the absolute value added to the business, in today’s money, after fully accounting for the time value of money and the cost of capital.
The Formula

Where CFₜ is the cash flow in year t, r is the discount rate (cost of capital), n is the project life, and C₀ is the initial investment.
One point that trips up beginners: the initial investment (C₀) is at Year 0 it’s already in today’s money, so it is never discounted. Only the future cash flows get discounted.
Calculation Using PV Factors
We pull the discount factors straight from the PVIF table in our PV factor table article, at 10%:
| Year | Cash flow | PVIF @ 10% | Present value |
|---|---|---|---|
| 1 | $30,000 | 0.9091 | $27,273 |
| 2 | $35,000 | 0.8264 | $28,924 |
| 3 | $30,000 | 0.7513 | $22,539 |
| 4 | $25,000 | 0.6830 | $17,075 |
| 5 | $20,000 | 0.6209 | $12,418 |
| Total PV of inflows | $108,229 |
NPV = $108,229 − $100,000 = +$8,229
The Decision Rule
The NPV decision rule is beautifully simple:
- NPV > 0 → Accept. The project earns more than the cost of capital, adding value.
- NPV < 0 → Reject. The project earns less than the cost of capital, destroying value.
- NPV = 0 → Indifferent. The project earns exactly the cost of capital.
Meridian’s NPV of +$8,229 is positive, so the project is accepted. In plain terms: after paying for the machine and compensating investors for the time value of their money at 10%, the project still leaves $8,229 of value, expressed in today’s dollars, on the table.
A critical insight about what NPV really means: an NPV of zero is not a bad outcome. A zero-NPV project still earns exactly the required 10% return, it just doesn’t beat it. This is the same idea from our PV factor table article: the discount rate already builds in the required return, so clearing zero means you’ve met the hurdle, and any positive NPV is value over and above it.
Method 4: Internal Rate of Return (IRR) — Calculated by Hand
The Internal Rate of Return is the discount rate at which a project’s NPV equals exactly zero.
Put differently: IRR is the project’s own inherent percentage rate of return. If NPV asks “how much value does this add at our cost of capital?”, IRR asks “what return does this project generate in its own right?”
This is where almost every competing guide online stops and says “use Excel’s =IRR() function.” We’re not going to do that because the manual method is exactly what ICAB, ACCA, and CFA exams require, and because doing it by hand reveals what IRR actually is in a way the Excel button hides.
The Decision Rule
- IRR > cost of capital → Accept. The project returns more than it costs to fund.
- IRR < cost of capital → Reject.
Calculating IRR by Linear Interpolation
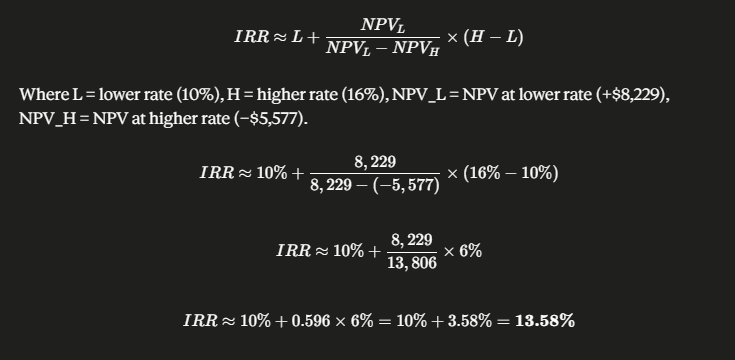
Because IRR can’t be solved directly with simple algebra for multi-year projects, we find it by trial and error plus interpolation: calculate NPV at two different discount rates (ideally one giving a positive NPV and one negative), then estimate where NPV crosses zero between them.
Step 1 — We already have NPV at 10%: +$8,229 (positive). We need a higher rate to push NPV negative. Let’s try 16%.
| Year | Cash flow | PVIF @ 16% | Present value |
|---|---|---|---|
| 1 | $30,000 | 0.8621 | $25,862 |
| 2 | $35,000 | 0.7432 | $26,011 |
| 3 | $30,000 | 0.6407 | $19,220 |
| 4 | $25,000 | 0.5523 | $13,807 |
| 5 | $20,000 | 0.4761 | $9,523 |
| Total PV | $94,423 |
NPV at 16% = $94,423 − $100,000 = −$5,577 (negative — good, we’ve bracketed the IRR)
Step 2 — Interpolate between the two rates. The IRR lies somewhere between 10% (where NPV = +$8,229) and 16% (where NPV = −$5,577). The interpolation formula:
Interpreting the Result
Meridian’s project has an IRR of approximately 13.58%. Since this comfortably exceeds the 10% cost of capital, the project is accepted — the same conclusion NPV reached, which is reassuring.
An honest caveat about interpolation: linear interpolation is an approximation. The true NPV curve is slightly curved, not a straight line, so the interpolated figure is marginally off from the precise IRR (which a spreadsheet would put near 13.3%). The closer together your two trial rates are, and the closer they bracket the true IRR, the more accurate the estimate. For exam purposes, interpolation between a positive and a negative NPV is the standard expected method, and full marks are awarded for the correct technique even though the answer is approximate.
The Head-to-Head: When the Methods Agree, and When They Don’t
Now we bring all four results together for Meridian’s single project:
| Method | Result | Hurdle | Decision |
|---|---|---|---|
| Payback period | 3.2 years | (Say) 4 years | |
| Accounting Rate of Return | 16% | 12% | |
| Net Present Value | +$8,229 | > $0 | |
| Internal Rate of Return | ~13.58% | > 10% |
For this project, all four methods agree: accept. This is common for a single, conventional project with healthy returns when a project is clearly good or clearly bad, the methods tend to concur.
The trouble starts with mutually exclusive projects where you can only choose one. Here, the methods can rank projects differently, forcing you to decide which method to trust.
Why NPV and IRR Can Disagree
Consider two mutually exclusive projects, both costing $100,000:
| Project Small | Project Large | |
|---|---|---|
| Initial investment | $100,000 | $100,000 |
| NPV at 10% | +$15,000 | +$22,000 |
| IRR | 25% | 18% |
IRR says choose Small (25% > 18%). NPV says choose Large (+$22,000 > +$15,000). They flatly contradict each other. Which is right?
NPV is right — choose Large. Here’s the intuition: IRR measures return as a percentage, but a percentage tells you nothing about scale. A spectacular 25% return on a small base can add less total wealth than a solid 18% return on a larger base. Since the goal of a business is to maximise absolute shareholder wealth actual dollars added the method that measures dollars (NPV) wins whenever it conflicts with the method that measures percentages (IRR).
This is the single most important conflict-resolution rule in investment appraisal: when NPV and IRR disagree on mutually exclusive projects, follow NPV. This conflict typically arises from differences in project scale (as above) or in the timing of cash flows.
Two More Problems Unique to IRR
The multiple-IRR problem. For “non-conventional” projects where cash flows change sign more than once (e.g., a large clean-up cost at the end produces a negative final cash flow) there can be more than one IRR, or none at all. A project with two sign changes can mathematically have two different IRRs, neither of which is meaningful. NPV has no such problem it always produces exactly one value.
The reinvestment assumption. IRR implicitly assumes interim cash flows are reinvested at the IRR itself, which can be unrealistically high. NPV assumes reinvestment at the cost of capital, which is more realistic. (A modified measure, MIRR, exists specifically to fix this assumption).
So Why Do Businesses Still Use IRR At All?
Given NPV’s theoretical superiority, why hasn’t IRR been abandoned? Because IRR has one genuine, practical advantage: it’s intuitive to communicate. Telling a board “this project returns 18%” lands more immediately than “this project has an NPV of $22,000” because 18% can be compared instantly against the cost of borrowing, against other investments, against a savings rate, with no further context needed. NPV’s dollar figure, by contrast, means little without knowing the project’s scale.
In practice, sophisticated finance teams calculate both: NPV to make the actual decision (especially when ranking competing projects), and IRR to communicate and sanity-check it. They are complementary, not rivals with the firm rule that when they conflict on mutually exclusive projects, NPV decides.
A Note on Real-World Complications
The Meridian example is deliberately clean to expose the mechanics. Real investment appraisals layer on complications that each deserve their own treatment:
Tax — cash flows should be after-tax, and the tax relief on depreciation (capital allowances / tax-allowable depreciation) creates its own cash flow stream that must be discounted.
Inflation — cash flows and discount rates must be treated consistently, either both in “money” (nominal) terms or both in “real” terms; mixing them is a classic error.
Working capital — many projects require an upfront investment in working capital (inventory, receivables) that ties up cash at the start and is released at the end.
Relevant cash flows only — appraisal uses incremental cash flows. Sunk costs (already spent, unrecoverable) are excluded; opportunity costs (value forgone elsewhere) are included. This connects to the relevant-costing principles examined throughout the ICAB and ACCA management accounting syllabi.
Common Mistakes
Mistake 1: Discounting the initial investment. The Year 0 outlay is already in present-value terms it must never be discounted. Only future cash flows are discounted.
Mistake 2: Confusing accounting profit with cash flow. Three of the four methods (payback, NPV, IRR) use cash flows; only ARR uses accounting profit. Mixing them up — for instance, deducting depreciation before calculating NPV is a serious error, because depreciation is a non-cash item and must not be deducted in cash-flow-based methods.
Mistake 3: Following IRR over NPV when they conflict. As shown, on mutually exclusive projects NPV is the reliable guide. Choosing the higher-IRR project can leave real money on the table.
Mistake 4: Forgetting cash flows beyond the payback point. Payback’s blindness to later cash flows means it should never be the sole basis for a decision only a supplementary screen.
Mistake 5: Interpolating IRR between two same-sign NPVs. The interpolation method only works reliably when one NPV is positive and the other negative, so the true IRR is genuinely bracketed between the two rates. Interpolating between two positive (or two negative) NPVs extrapolates beyond the data and produces an unreliable figure.
Mistake 6: Using inconsistent rates and cash flows for inflation. If cash flows include inflation (nominal), the discount rate must also be nominal; if cash flows exclude it (real), the rate must be real. This is one of the most frequently penalised errors in professional exams.
Summary
- Investment appraisal evaluates whether long-term investments are worthwhile, using four main methods split into non-discounting (Payback, ARR) and discounting (NPV, IRR) families.
- Payback period measures how quickly the initial investment is recovered simple and useful for liquidity, but ignores both the time value of money and all cash flows beyond the payback point.
- Accounting Rate of Return (ARR) expresses average accounting profit as a percentage of investment considers the whole project life but ignores the time value of money and relies on accounting profit rather than cash.
- Net Present Value (NPV) discounts all future cash flows to today and subtracts the initial investment; NPV > 0 means accept. It measures absolute value added and is the theoretically superior method. The initial investment is never discounted.
- Internal Rate of Return (IRR) is the discount rate at which NPV = 0, found manually by linear interpolation between a positive and a negative NPV; accept when IRR exceeds the cost of capital.
- When NPV and IRR conflict on mutually exclusive projects, follow NPV because it measures absolute wealth (dollars), while IRR measures percentage return and ignores project scale.
- IRR also suffers from the multiple-IRR problem (non-conventional cash flows) and an unrealistic reinvestment assumption neither of which affects NPV.
Frequently Asked Questions (FAQs)
NPV is generally regarded as the theoretically superior method, because it directly measures the absolute value (in today's money) added to the business and correctly accounts for the time value of money. However, the best practice is to use several methods together NPV for the decision, IRR for intuitive communication, and payback as a liquidity/risk screen since each offers a different perspective. When NPV and IRR conflict on mutually exclusive projects, NPV should decide.
Because the initial investment occurs at Year 0 right now it is already expressed in today's money. Discounting converts future amounts into present-day terms; an amount that's already in present-day terms needs no conversion. Only the future cash inflows (Years 1 onward) are discounted.
By trial and error plus linear interpolation. Calculate the project's NPV at two discount rates ideally one that gives a positive NPV and one that gives a negative NPV, so the true IRR is bracketed between them. Then apply the interpolation formula: IRR ≈ Lower rate + [NPV at lower rate ÷ (NPV at lower rate − NPV at higher rate)] × (Higher rate − Lower rate). This is the standard method required in ICAB, ACCA, and CFA examinations.
Not necessarily in cash terms. A negative NPV means the project fails to earn the required rate of return (the cost of capital) it may still generate a cash surplus in raw terms, but not enough to compensate investors for the time value of their money and the risk taken. In value terms, a negative-NPV project destroys shareholder value and should be rejected.
NPV tells you how much absolute value (in dollars) a project adds at your specific cost of capital, while IRR tells you the project's own percentage return regardless of your cost of capital and the two can rank competing projects differently because one measures dollars and the other measures percentages.
ARR is deliberately designed to connect with the financial statements and the return-on-capital ratios that managers and investors already track, all of which are profit-based. The other three methods focus on cash because cash not accounting profit is what actually funds the business and compensates investors. This is also ARR's main weakness: because it relies on accounting profit, it's sensitive to accounting policy choices like the depreciation method, which don't affect the cash-based methods.
References
- Brealey, R.A., Myers, S.C. and Allen, F. Principles of Corporate Finance. 13th edition. McGraw-Hill, 2020. (Investment criteria: NPV, IRR, payback, and book rate of return)
- Ross, S.A., Westerfield, R.W. and Jordan, B.D. Fundamentals of Corporate Finance. 12th edition. McGraw-Hill, 2021. (Net present value and other investment criteria)
- Atrill, P. and McLaney, E. Management Accounting for Decision Makers. 9th edition. Pearson, 2018. (Capital investment decisions)
- Institute of Chartered Accountants of Bangladesh (ICAB). Professional Level — Financial Management Study Material: Investment Appraisal Techniques. Available at: icab.org.bd
- ACCA. Financial Management (FM) — Study Text: Investment Appraisal (NPV, IRR, Payback, ARR). Kaplan Publishing / BPP Learning Media.
- CFA Institute. CFA Program Curriculum, Level I — Corporate Issuers: Capital Budgeting. CFA Institute.
- Drury, C. Management and Cost Accounting. 10th edition. Cengage Learning, 2018. (Capital investment decisions and discounted cash flow)
Disclaimer: For specific investment or capital budgeting advice, consult a qualified professional.


